Telecom insight / how-to · Market Research / CATI
Per-DID Answer Rate: The Number CATI Floors Don’t Track
Every CATI floor tracks contact rate. Dials, contacts, completes, incidence, cost per complete. All of it rolls up to a single number that the project manager reports and the client reads.
That number is an average. And an average across a pool of outbound numbers is exactly the wrong shape for the problem many floors actually have.
Quick answer
CATI teams should measure answer rate per DID.
CATI teams should measure answer rate per DID because pooled contact rate hides number-level problems. Two flagged or poorly performing outbound numbers can quietly drag down an entire floor’s contact rate. Pull 30 days of CDRs, group by calling number, compare answer rate, median answered duration, and SIP cause-code mix, then remove or remediate numbers that are underperforming.
Core idea
The average hides the broken number.
A pooled CATI contact rate can look acceptable while one or two DIDs in the outbound pool are already flagged, screened, or underperforming.
What is per-DID answer rate?
Per-DID answer rate is the answer rate calculated separately for each outbound calling number in your DID pool. Instead of asking, “What was the floor’s contact rate?”, it asks, “Which specific calling numbers are helping or hurting the floor?”
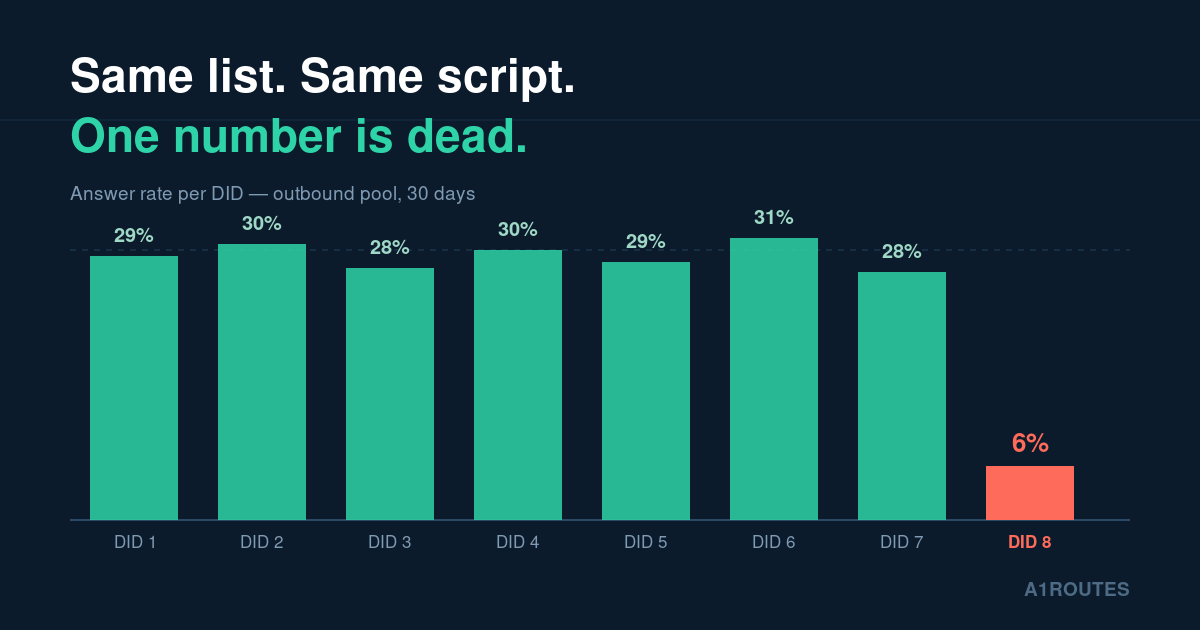
Here is the thing many teams do not instrument: the numbers in your outbound pool do not perform the same. Same sample, same script, same interviewers, same time of day — and one DID may connect at 30% while the one next to it connects at 6%. If you only look at the roll-up, you see a contact rate that drifted from 24% to 19% over six weeks and go looking for a sample problem. The sample may be fine. Two of your twelve numbers may be sitting on a carrier or analytics-provider label.
Why does average CATI contact rate hide bad numbers?
Arithmetic. If ten numbers run at 30% and two run at 5%, your pooled rate is about 26%. That looks like a soft quarter, not a fault. Nothing in that number tells you the problem is concentrated.
Worse, most dialers distribute calls across the pool evenly, so the bad numbers keep getting fed. Every dial through a flagged DID is a dial you paid for that had a lower chance of being answered before the phone even rang. On a floor doing 40,000 dials a week, two dead numbers out of twelve is roughly 6,600 wasted attempts a week — and the cost shows up in your cost-per-complete, where it looks like the sample got more expensive.
The mechanism is simple and it is not only on your side of the call. Carriers and handset analytics companies score numbers on call volume, call duration distribution, answer rate, and consumer complaints. A survey dialer can look statistically similar to a nuisance dialer: high volume, short average duration, low answer rate, lots of unique destinations. Once a number crosses a threshold, it may get labelled as “Scam Likely,” “Potential Spam,” or another call-labeling warning. The label then becomes self-reinforcing because labelled numbers get answered less, which can push the score further down.
Your interviewers never see that label. They see a ring-out.
How do CATI teams measure answer rate per DID?
You need answer rate per DID, not just per campaign. Everything you need is already in your CDRs. This is a 20-minute exercise, not a major project.
- Pull 30 days of outbound CDRs. Fields you need: calling number, called number, start time, answer time, end time, duration, billsec, and SIP hangup cause. Most switches and dialers can export this. FreeSWITCH `cdr_csv` or `json_cdr` output and Asterisk CDR data commonly include enough to start.
- Group by calling number. One row per DID.
- Compute answer rate. Use calls where `billsec > 0` divided by total attempts for that DID.
- Compare median answered duration. Use the median, not the mean. One long interview can drag the mean up and hide the pattern.
- Review cause-code distribution. Look at SIP cause codes as a percentage of attempts for each DID.
- Sort by spread, not average. Healthy pools cluster. If your best DID is at 31% and your worst is at 6%, that spread is the finding.
Then cross-check the calendar. A number that degrades gradually over two or three weeks may have been scored and labelled. A number that falls off a cliff on a specific date may have lost something structural: a porting event, route change, or caller ID passthrough issue.
That distinction matters because the fixes are different.
Operational checklist
The 20-minute CDR check
- Pull 30 days of outbound CDRs
- Group by calling number
- Calculate answer rate per DID
- Compare median answered duration
- Review SIP cause-code distribution
- Sort by answer-rate spread, not average
- Check whether weak numbers degraded gradually or dropped suddenly
Which SIP cause codes suggest a flagged or unhealthy number?
This is where you can stop guessing. SIP hangup causes are the closest thing you get to the far end telling you what happened. For the full plain-English reference, see the A1ROUTES SIP Cause Codes Guide.
- `NO_ANSWER` / cause 19. It rang and nobody picked up. On its own, this is normal. What matters is the ratio: a DID where 90%+ of attempts end in no answer while neighbouring DIDs sit much lower may be getting screened.
- `USER_BUSY` / cause 17. This can be genuinely busy, or sometimes a carrier-side rejection dressed up as busy. Watch for one DID whose busy rate spikes suddenly across many unrelated destinations.
- `CALL_REJECTED` / cause 21. An explicit reject. Sometimes a consumer call-blocking app, sometimes the terminating carrier. A rising reject rate on one DID is a strong signal to investigate number reputation.
- `NORMAL_UNSPECIFIED` / cause 31 and `NETWORK_OUT_OF_ORDER` / cause 38 clustered on one route. That may be an upstream route issue, not a reputation issue. Escalate with timestamps and destinations.
- `NORMAL_CLEARING` / cause 16 with billsec of 0 or 1. The call “succeeded” and ended immediately. Sub-second answered calls can inflate what a dialer calls a connect without representing a real human answer.
That last point matters because connect rate is not answer rate. Your dialer’s connect rate may count calls that received an answer signal. Answer rate, done properly, should count calls where a human was plausibly on the line. If your dialer says 22% and your CDRs say 14%, the gap may be sitting in sub-second cause-16 calls and answering-machine events counted as connects.
What should CATI teams do with a flagged DID?
Honest answer first: you cannot magically un-flag a number, and you cannot fix a reputation problem just by rotating numbers faster.
Rotation is the standard reflex: burn the number, get a new one, keep dialing. It may work for a while. But the calling behaviour that got the first number scored is still running, so the new number can get scored the same way later. Rotation buys a lag, not a full fix. Meanwhile, callbacks may land on DIDs nobody at the floor owns anymore, which quietly costs completes on the back end.
What actually helps is more boring and more operational:
- Register and remediate with analytics providers. The main handset-labelling databases have registration and reporting paths. It is tedious form-filling, but it changes the label problem rather than trying to dodge it.
- Get STIR/SHAKEN attestation right. For US calling, A-level STIR/SHAKEN attestation is table stakes. It says the originating carrier vouches that you are entitled to use the number. It does not mean the call is wanted, and it does not guarantee calls avoid labels.
- Use local numbers that match sample geography, and keep them stable. People answer numbers they recognise the shape of. But local presence built with huge throwaway pools can become the pattern that gets scored.
- Cap per-DID daily volume. A number doing thousands of attempts a day with low answer rate and short median duration can resemble nuisance traffic. Spread volume across a healthier stable pool instead of overloading one DID.
- Give the number a reason to look legitimate. A DID that only ever originates and never terminates is weak. Numbers that support callbacks, a real IVR, and a real business identity tend to look more legitimate.
- Use an evidence-based retirement policy. Do not rotate every N days by habit. Rotate or retire based on answer-rate decline, cause-code mix, and comparison against the pool median.
What does this look like on a CATI floor?
Imagine a fielding operation running 12 DIDs across three regions.
You pull the CDRs Monday morning. Eight numbers sit between 26% and 31% answer rate. Two sit around 20%. Two are at 6% and 7%, both with heavy no-answer patterns and a visible three-week slide.
That is not automatically a sample issue, and interviewer coaching will not fix it. Pull those two from outbound rotation, keep them pointed at the IVR for inbound callbacks, submit remediation where appropriate, and redistribute their share across healthier local DIDs with a realistic attempts-per-day cap. Recheck in two weeks.
The pooled contact rate can rise simply because you stopped burning a chunk of dials on numbers that had little chance of connecting. Nothing about the sample changed.
Pull quote
Contact rate is a reporting metric. Answer rate per DID is an operating metric.
It tells you which specific piece of your outbound infrastructure is broken this week. Track the spread across your pool and you can find problems before the roll-up moves enough for anyone to notice.
Why is answer rate per DID an operating metric?
If you run a CATI floor and you have never pulled this view, pull it once. Sometimes the spread is flat and you have ruled out a whole class of problems, which is worth knowing. Other times, one or two numbers are quietly costing you several points of contact rate and a chunk of your cost-per-complete.
The point is not to blame every failed call on number reputation. The point is to separate the categories: bad sample, bad timing, weak number reputation, caller ID issues, route problems, and short answered-call artefacts. Per-DID answer rate plus SIP cause-code mix gives managers a better way to decide what to fix.
FAQ
Per-DID answer rate questions
What is per-DID answer rate?
Per-DID answer rate measures the percentage of outbound attempts answered for each individual calling number in a DID pool.
Why is pooled contact rate misleading for CATI floors?
A pooled rate averages every outbound number together, so one or two unhealthy DIDs can hide inside an acceptable-looking floor average.
How do I calculate answer rate per DID from CDRs?
Pull outbound CDRs, group by calling number, then divide answered calls by total attempts for each DID. Compare spread across numbers, not only the average.
Which SIP cause codes indicate a number may be flagged?
High no-answer, busy, rejected, and sub-second answered-call patterns on one DID compared with nearby DIDs can suggest screening, labeling, or reputation issues.
Should CATI teams rotate numbers automatically?
No. Rotation without behavior change usually buys time, not a fix. Use evidence-based retirement, remediation, volume caps, attestation, and callback handling.
What should I do when one DID performs far worse than the pool?
Pull it from outbound rotation, keep inbound callbacks available where appropriate, review the cause-code mix, remediate if relevant, and redistribute volume across healthier numbers.
CATI calling review
Want to see which numbers are dragging your CATI floor down?
A1ROUTES can review 30 days of outbound CDRs, break out answer rate and SIP cause-code mix per DID, and help identify which numbers are healthy, which may be flagged, and which patterns point to routing or data-quality issues.