Travel Voice Infrastructure · Article 6
Your Ad Dashboard Stops Right Where the Booking Starts
Most travel marketers can tell you their cost-per-click to two decimal places. Ask what a booking call actually costs, or how many of those calls were answered, and the data usually gets fuzzy. Your analytics are sharp until the customer picks up the phone. This article shows which call metrics to track, and what failed calls are trying to tell you.
The blind spot: clicks are measured to death, calls are not measured at all
We have written before about using DIDs to see which ads drive booking calls. Attribution is the foundation. Once you can tie a call back to the ad that made it happen, you can finally start measuring the part of the funnel where travel money is actually made.
For many travel businesses, the phone is the checkout. Clicks and form fills are the doorway. If you want to grow without simply spending more, the call is exactly where your data should be sharpest.
The metrics your ad dashboard usually cannot see
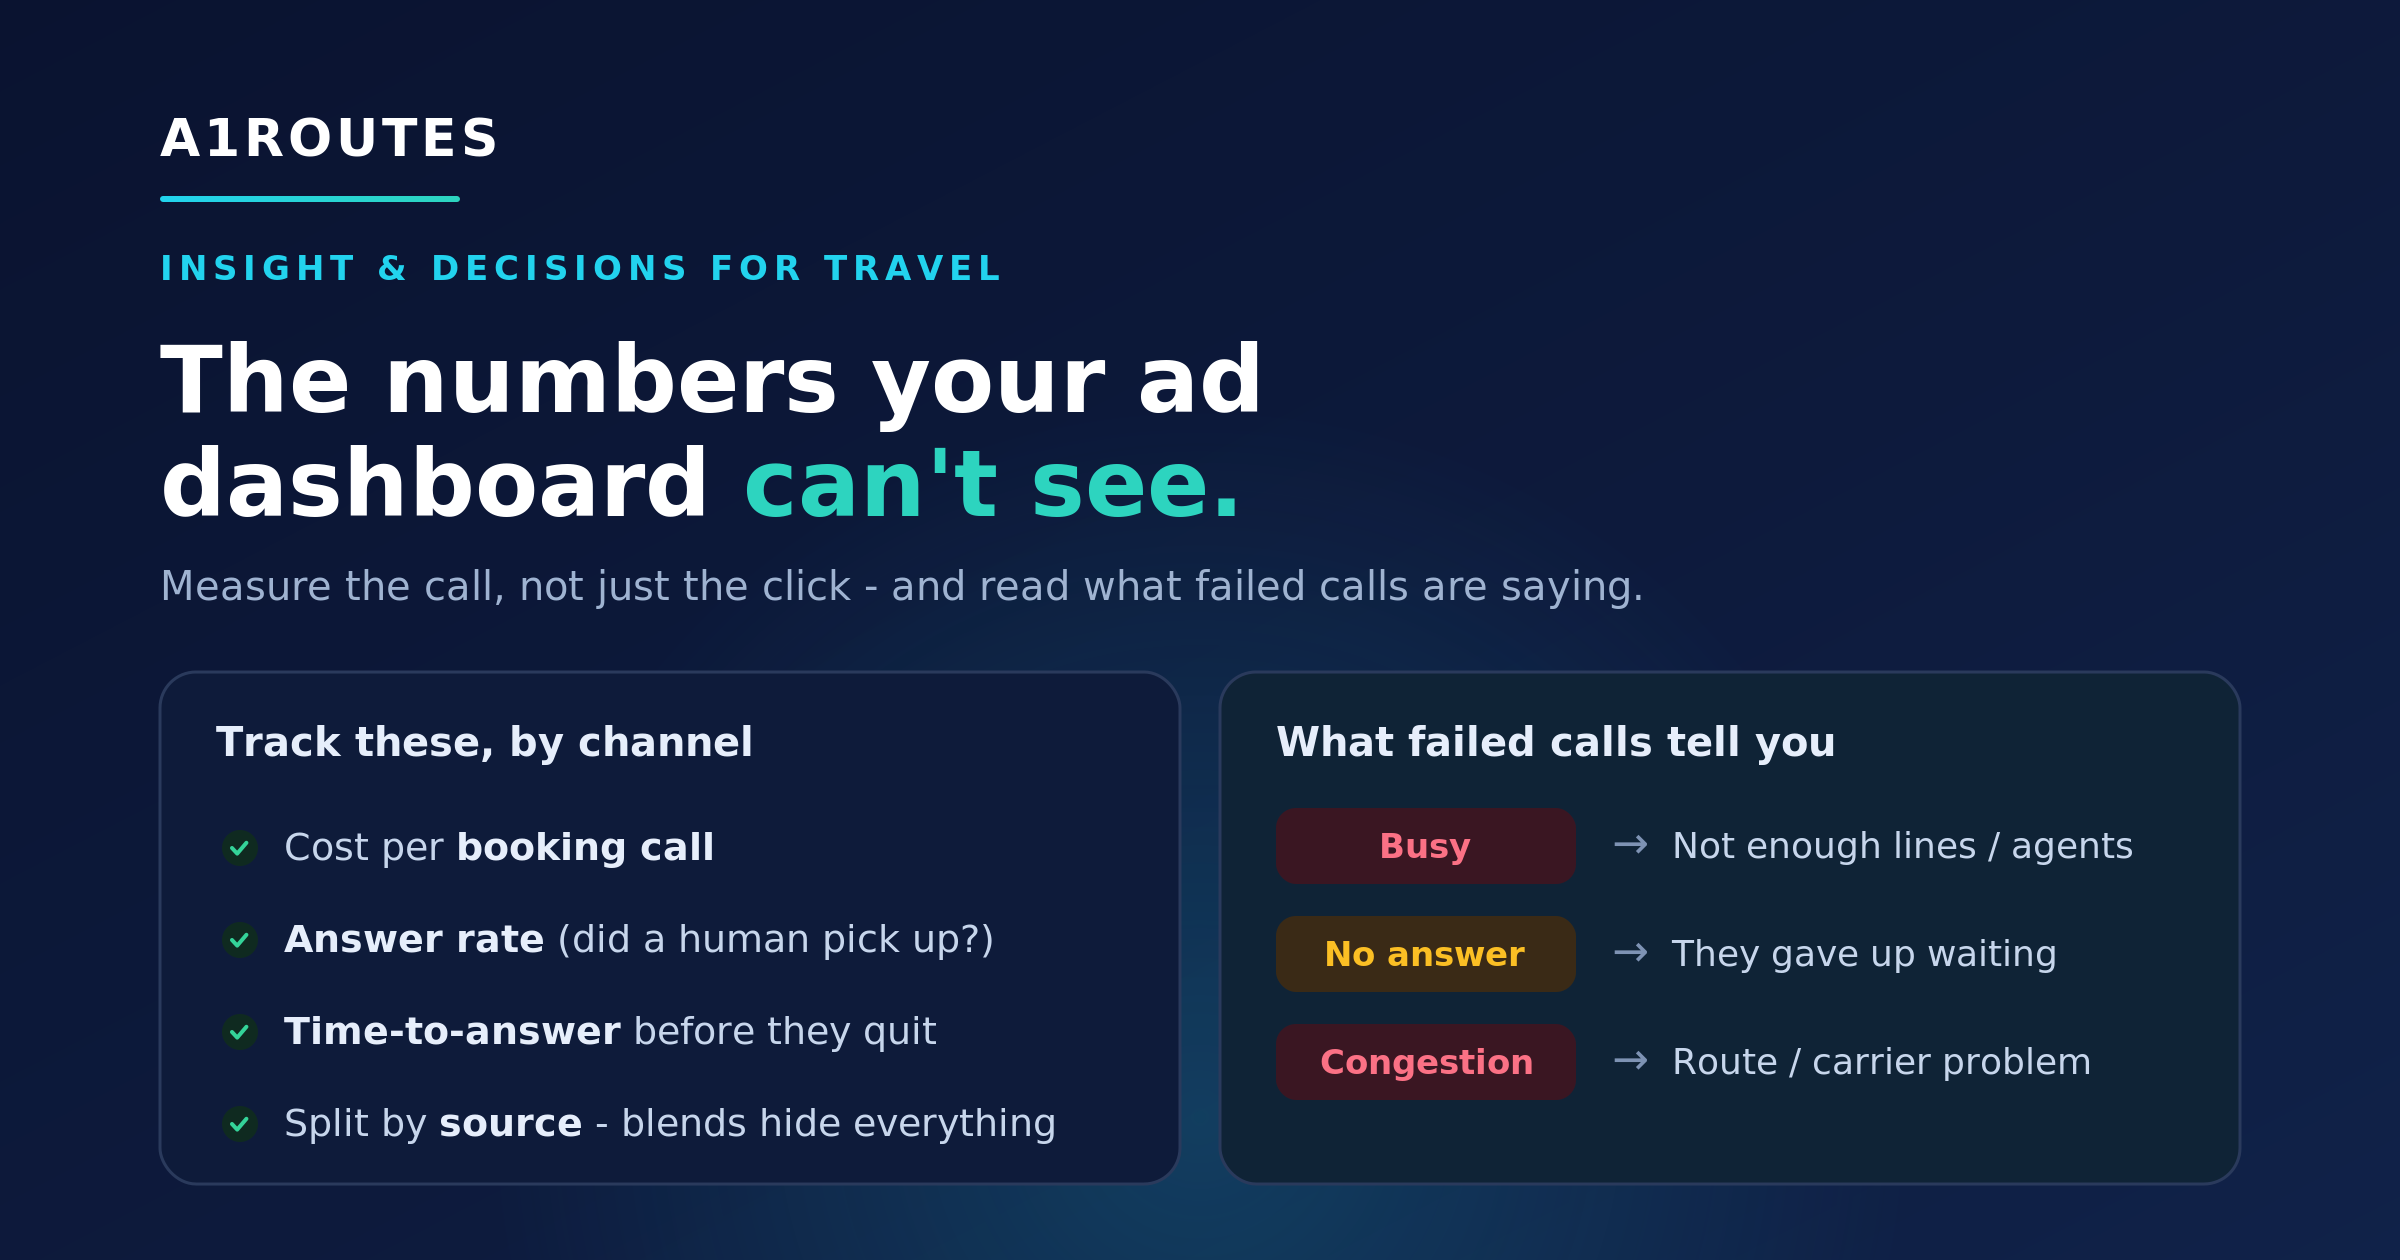
Cost per booking call
What did it cost to generate a real phone conversation with booking intent?
Answer rate
How many paid-for calls were actually answered by a human?
Time-to-answer
How long did the caller wait before someone picked up?
Source-level performance
Which channel produced calls that actually became conversations?
Four call metrics that actually tell you something
You do not need a wall of dashboards. A handful of numbers, tracked honestly, will tell you more about real booking performance than click-through rate alone.
Cost per booking call. Not cost per click, not cost per lead: cost per call from a real person with booking intent. Divide channel spend by genuine booking calls and your media plan may reorder itself.
Answer rate. Of the calls your ads generated, how many did a human actually pick up? If you pay to make the phone ring and answer only part of the time, budget leaks before an agent says hello. We covered caller ID, spam flags, and foreign-looking numbers in this travel caller ID guide.
Time-to-answer. A high-intent traveler may wait a few rings. They usually will not wait through a long menu and thirty seconds of silence. Watch this closely during campaigns, when volume spikes and answer speed often slips.
All of the above, broken out by channel. Blended averages hide the useful story. Split cost per booking call, answer rate, and time-to-answer by source: Google, Meta, partner, organic, repeat customer, or DID pool.
Call metrics review
Do you know your cost per booking call?
A1ROUTES can help travel teams connect call outcomes back to campaigns, markets, and DID pools so paid traffic can be judged by real booking conversations, not just clicks.
Your failed calls are data too, and most people throw them away
When a call does not connect, it does not simply disappear into the void. In SIP-based telephony, the network often returns a cause code. Most travel teams never use these signals, but failed-call patterns can reveal capacity, routing, data, or configuration issues.
Think of cause codes as the call's version of an error message. One code alone may not prove the story. A repeated pattern by campaign, route, source, or time of day can point to a specific fix.
SIP visibility
Failed calls are not just failures. They are signals.
Busy
Not enough lines or agents during campaign traffic.
No answer / caller cancelled
The caller may have waited too long or abandoned the call.
Congestion / temporary failure
Possible route or carrier issue.
Rejected / forbidden / unallocated
Possible configuration, number, or policy issue.
When these signals are grouped by campaign, route, source, or time of day, they can point to very specific fixes.
Read the SIP Cause Codes GuideWhat SIP cause codes often mean for travel teams
User busy. If busy signals pile up during campaigns, it often indicates a capacity problem: not enough lines, agents, or answering paths for the traffic your ads created.
No answer and caller-cancelled codes. These are calls that rang and were abandoned before anyone answered. A cluster points toward answer speed, queue design, or staffing.
Congestion, no circuit available, or temporary failures. These can indicate a route or carrier-side condition. If they spike, it is worth reviewing route behavior and escalating if the pattern recurs.
Unallocated number, rejected, or forbidden. These can point to number format, configuration, policy, or routing problems. They are worth chasing down because they can quietly affect a specific number, route, or campaign.
Failed-call review
Seeing failed calls but not sure why?
A1ROUTES gives teams better visibility into SIP cause codes, failed-call patterns, and retry signals so managers can separate data problems from routing problems.
Turning all this into decisions
Numbers only matter if they change what you do next. Read together, call metrics and SIP signals point to concrete actions: reallocate spend, adjust staffing, improve routing, clean data, or escalate route quality.
Likely issue
Wrong channel, weak targeting, or poor call conversion.
Action
Reallocate spend or inspect call handling.
Likely issue
Caller ID, spam flags, staffing, or route quality.
Action
Review caller ID, local termination, and staffing.
Likely issue
Queue, IVR, routing, or agent availability.
Action
Improve hunt groups, Cloud PBX routing, or overflow handling.
Likely issue
Not enough lines, agents, or capacity.
Action
Add capacity or adjust routing during campaign peaks.
Likely issue
Temporary route or carrier problem.
Action
Retry, monitor pattern, and escalate if recurring.
Likely issue
Poor data quality or wrong number format.
Action
Clean lead data and avoid blind redialing.
30-day travel call metrics starter audit
Channel-level tracking
- Track calls by Google, Meta, partner, organic, and repeat customer sources.
- Assign DIDs or DID pools where needed.
- Compare cost per booking call, not just cost per click.
Answer and speed
- Measure answer rate by channel.
- Measure time-to-answer during campaign peaks.
- Identify abandoned calls and voicemail-heavy sources.
Failed-call signals
- Review busy, no-answer, 404, 480, 486, and 503 patterns.
- Separate data-quality problems from route or capacity problems.
- Escalate repeated congestion or provider-side patterns.
Action plan
- Reallocate spend from weak channels.
- Improve routing or staffing during spikes.
- Clean bad lead data.
- Review caller ID and local termination where answer rates are low.
Where to start
You do not need a data team. Start by measuring two things for one month: answer rate and cost per booking call by channel. That alone usually surfaces at least one uncomfortable surprise: a channel that looks good on clicks but weak on calls, or an answer rate lower than anyone expected.
From there, add time-to-answer and start reviewing failed-call reasons. The goal is not perfect diagnosis from one code. The goal is to reduce guesswork and make better operating decisions.
Voice Reliability Review
Measure the call, not just the click
If your travel campaigns generate phone enquiries, A1ROUTES can help you see what happens after the click: which channel drove the call, whether the call was answered, how long the caller waited, and what failed calls are trying to tell you.
We can start with one market, one DID pool, or one campaign, then expand once the reporting points to clear improvements.